In the case of nucleic acids, the direction of migration, from negative to positive electrodes, is due to the naturally-occurring negative charge carried by their sugar-phosphate backbone. Double-stranded
Gel electrophoresis of large DNA or RNA is usually done by agarose gel electrophoresis.
After the separation is completed, the fractions of
The types of gel most commonly used for
The
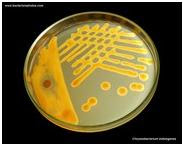
Agarose gel electrophoresis
Background
Agarose gel electrophoresis is the easiest and commonest way of separating and analyzing
What percentage gel?
Most agarose gels are made between 0.7% and 2%. A 0.7% gel will show good separation (resolution) of large DNA fragments (5–10kb) and a 2% gel will show good resolution for small fragments (0.2–1kb). Some people go as high as 3% for separating very tiny fragments but a vertical polyacrylamide gel is more appropriate in this case. Low percentage gels are very weak and may break when you try to lift them. High percentage gels are often brittle and do not set evenly. I usually make 1% gels.
Which gel tank?
Small 8x10cm gels (minigels) are very popular and give good photographs. Larger gels are used for applications such as Southern and Northern blotting. The volume of agarose required for a minigel is around 30–50mL, for a larger gel it may be 250mL. This method assumes you are making a mini-gel.
How much
The big question. You may be preparing an analytical gel to just look at your
Now consider an example. Suppose you are digesting a plasmid that comprises 3kb of vector and 2kb of insert. You are using EcoRI (a common restriction enzyme) and you expect to see three bands: the linearised vector (3kb), the 5' end of the insert (0.5kb) and the 3' end of the insert (1.5kb). In order to see the smallest band (0.5kb) you want it to contain at least 20ng of
Now imagine cutting the same plasmid with BamHI (another popular restriction enzyme) and that BamHI only cuts the plasmid once, to linearise it. If you digest 200ng of
Too much
Too little
Having said all that, I usually digest and load 2–4µL of the 50µL obtained from a kit miniprep. But you see how it depends on the number and size of the bands expected.
For PCR reactions, it depends on the PCR but in routine applications 10–20µL should be plenty to see the product on the gel.
Which comb?
This depends on the volume of
Making the gel (for a 1% gel, 50mL volume)
Weigh out 0.5g of agarose into a 250mL conical flask. Add 50mL of 0.5xTBE , swirl to mix.
It is good to use a large container, as long as it fits in the microwave, because the agarose boils over easily.
Microwave for about 1 minute to dissolve the agarose.
The agarose solution can boil over very easily so keep checking it. It is good to stop it after 45 seconds and give it a swirl. It can become superheated and NOT boil until you take it out whereupon it boils out all over you hands. So wear gloves and hold it at arms length. You can use a bunsen burner instead of a microwave - just remember to keep watching it.
Leave it to cool on the bench for 5 minutes down to about 60°C (just too hot to keep holding in bare hands).
If you had to boil it for a long time to dissolve the agarose then you may have lost some water to water-vapour. You can weigh the flask before and after heating and add in a little distilled water to make up this lost volume. While the agarose is cooling, prepare the gel tank ready, on a level surface.
Add 1µL of ethidium bromide (10mg/mL) and swirl to mix
The reason for allowing the agarose to cool a little before this step is to minimise production of ethidium bromide vapour. Ethidium Bromide is mutagenic and should be handled with extreme caution. Dispose of the contaminated tip into a dedicated ethidium bromide waste container. 10mg/mL ethidium bromide solution is made up using tablets (to avoid weighing out powder) and is stored at 4°C in the dark with TOXIC labels on it.
Pour the gel slowly into the tank. Push any bubbles away to the side using a disposable tip. Insert the comb and double check that it is correctly positioned.
The benefit of pouring slowly is that most bubbles stay up in the flask. Rinse out the flask immediately.
Leave to set for at least 30 minutes, preferably 1 hour, with the lid on if possible.
The gel may look set much sooner but running
Pour 0.5x TBE buffer into the gel tank to submerge the gel to 2–5mm depth. This is the running buffer.
You must use the same buffer at this stage as you used to make the gel. ie. If you used 0.6xTBE in the gel then use 0.6xTBE for the running buffer. Remember to remove the metal gel-formers if your gel tank uses them.
Preparing the samples
Transfer an appropriate amount of each sample to a fresh microfuge tube.
It may be 10µL of a 50µL PCR reaction or 5µL of a 20µL restriction enzyme digestion. If you are loading the entire 20µL of a 20µL PCR reaction or enzyme digestion (as I often do) then there is no need to use fresh tubes, just add in the loading buffer into the PCR tubes. Write in your lab-book the physical order of the tubes so you can identify the lanes on the gel photograph.
Add an appropriate amount of loading buffer into each tube and leave the tip in the tube.
Add 0.2 volumes of loading buffer, eg. 2µL into a 10µL sample. The tip will be used again to load the gel.
Load the first well with marker.
I store my markers ready-mixed with loading buffer at 4°C. I know to load 2µL and how much DNA is in each band. See below for more on this.
Avoid using the end wells if possible. For example, If you have 12 samples and 2 markers then you will use 14 lanes in total. If your comb formed 18 wells then you will not be using 4 wells. It is best to not use the outer wells because they are the most likely to run aberrantly.
Continue loading the samples and finish of with a final lane of marker
I load gels from right to left with the wells facing me. This is because gels are published, by convention, as if the wells were at the top and the
Close the gel tank, switch on the power-source and run the gel at 5V/cm.
For example, if the electrodes are 10cm apart then run the gel at 50V. It is fine to run the gel slower than this but do not run any faster. Above 5V/cm the agarose may heat up and begin to melt with disastrous effects on your gel's resolution. Some people run the gel slowly at first (eg. 2V/cm for 10 minutes) to allow the DNA to move into the gel slowly and evenly, and then speed up the gel later. This may give better resolution. It is OK to run gels overnight at very low voltages, eg. 0.25–0.5V/cm, if you want to go home at
Check that a current is flowing
You can check this on the power-source, the milliamps should be in the same ball-park as the voltage, but the the best way is to look at the electrodes and check that they are evolving gas (ie. bubbles). If not then check the connections, that the power-source is plugged in etc.etc. This has been known to happen if people use water instead of running buffer.
Monitor the progress of the gel by reference to the marker dye.
Stop the gel when the bromophenol blue has run 3/4 the length of the gel.
Switch off and unplug the gel tank and carry the gel (in its holder if possible) to the dark-room to look at on the UV light-box.
Some gel holders are not UV transparent so you have to carefully place the gel onto the glass surface of the light-box. UV is carcinogenic and must not be allowed to shine on naked skin or eyes. So wear face protection, gloves and long sleeves.
The loading buffer gives colour and density to the sample to make it easy to load into the wells. Also, the dyes are negatively charged in neutral buffers and thus move in the same direction as the
Typical recipe
- 25mg bromophenol blue or xylene cyanol
- 4g sucrose
- H2O to 10mL
The exact amount of dye is not important
Store at 4°C to avoid mould growing in the sucrose. 10mL of loading buffer will last for years.
Bromophenol blue migrates at a rate equivalent to 200–400bp
Xylene cyanol migrates at approximately 4kb equivalence. So do not use this if you want to visualise fragments of 4kb.
There are lots of different kinds of
People also use TAE (Tris Acetate EDTA). Make up a 10x stock using cheap reagents. Do not use expensive 'analytical grade' reageants. Cheap Tris base and boric acid can be bought in bulk.
Recipe for 2L of 10xTBE
- 218g Tris base
- 110g Boric acid
- 9.3g EDTA
Dissolve the ingredients in 1.9L of distilled water. pH to about 8.3 using NaOH and make up to 2L.
No responsibility is assumed by methodbook.net for any injury and/or damage to persons or property as a matter of products liability, negligence or otherwise, or from any use or operation of any methods, products, instructions or ideas contained in the material herein. It is the users responsibility to ensure that all procedures are carried out according to appropriate Health and Safety requirements.
Capillary electrophoresis
Capillary electrophoresis (CE), also known as capillary zone electrophoresis (CZE), can be used to separate ionic species by their charge and frictional forces. In traditional electrophoresis, electrically charged analytes move in a conductive liquid medium under the influence of an electric field. Introduced in the 1960s, the technique of capillary electrophoresis (CE) was designed to separate species based on their size to charge ratio in the interior of a small capillary filled with an electrolyte. While its use has been sporadic, CE offers unparalleled resolution and selectivity allowing for separation of analytes with very little physical difference. Efficiencies of millions of plates are routinely reported. Once thought impossible, separation of large proteins differing in only one amino acid (ie. D-Lysine substituted for L-Lysine) and even an isotopic separation of 14N and 15N ammonium hydroxide have been reported. No other technique has shown such powerful selectivity with the ability for extremely high sensitivity. As few as 6 molecules of a substance have been separated and detected with the help of laser-induced fluorescence (LIF).
Instrumentation
The instrumentation needed to perform capillary electrophoresis is relatively simple. A basic schematic of a capillary electrophoresis system is shown in figure 1. The system's main components are a sample vial, source and destination vials, a capillary, electrodes, a high-voltage power supply, a detector, and a data output and handling device. The source vial, destination vial and capillary are filled with an electrolyte such as an aqueous buffer solution. To introduce the sample, the capillary inlet is placed into a vial containing the sample and then returned to the source vial (sample is introduced into the capillary via capillary action, pressure, or siphoning). The migration of the analytes is then initiated by an electric field that is applied between the source and destination vials and is supplied to the electrodes by the high-voltage power supply. It is important to note that all ions, positive or negative, are pulled through the capillary in the same direction by electroosmotic flow, as will be explained. The analytes separate as they migrate due to their electrophoretic mobility, as will be explained, and are detected near the outlet end of the capillary. The output of the detector is sent to a data output and handling device such as an integrator or computer. The data is then displayed as an electropherogram, which reports detector response as a function of time. Separated chemical compounds appear as peaks with different retention times in an electropherogram.
Detection
Separation by capillary electrophoresis can be detected by several detection devices. The majority of commercial systems use UV or UV-Vis absorbance as their primary mode of detection. In these systems, a section of the capillary itself is used as the detection cell. The use of on-tube detection enables detection of separated analytes with no loss of resolution. In general, capillaries used in capillary electrophoresis are coated with a polymer for increased stability. The portion of the capillary used for UV detection, however, must be optically transparent. Bare capillaries can break relatively easily and, as a result, capillaries with transparent coatings are available to increase the stability of the cell window. The path length of the detection cell in capillary electrophoresis (~ 50 micrometers) is far less than that of a traditional UV cell (~ 1 cm). According to the Beer-Lambert law, the sensitivity of the detector is proportional to the path length of the cell. To improve the sensitivity, the path length can be increased, though this results in a loss of resolution. The capillary tube itself can be expanded at the detection point, creating a "bubble cell" with a longer path length or additional tubing can be added at the detection point as shown in figure 2. Both of these methods, however, will decrease the resolution of the separation.
Fluorescence detection can also be used in capillary electrophoresis for samples that naturally fluoresce or are chemically modified to contain fluorescent tags. This mode of detection offers high sensitivity and improved selectivity for these samples, but cannot be utilized for samples that do not fluoresce. The set-up for fluorescence detection in a capillary electrophoresis system can be complicated. The method requires that the light beam be focused on the capillary, which can be difficult for many light sources. Laser-induced fluorescence has been used in CE systems with detection limits as low as 10-18 to 10-21 mol. The sensitivity of the technique is attributed to the high intensity of the incident light and the ability to accurately focus the light on the capillary.
In order to obtain the identity of sample components, capillary electrophoresis can be directly coupled with mass spectrometers or Surface Enhanced Raman Spectroscopy (SERS). In most systems, the capillary outlet is introduced into an ion source that utilizes electrospray ionization (ESI). The resulting ions are then analyzed by the mass spectrometer. This set-up requires volatile buffer solutions, which will affect the range of separation modes that can be employed and the degree of resolution that can be achieved. The measurement and analysis are mostly done with a specialized gel analysis software.
For CE-SERS, capillary electrophoresis eluants can be deposited onto a SERS-active substrate. Analyte retention times can be translated into spatial distance by moving the SERS-active substrate at a constant rate during capillary electrophoresis. This allows the subsequent spectroscopic technique to be applied to specific eluants for identification with high sensitivity. SERS-active substrates can be chosen that do not interfere with the spectrum of the analytes.
Modes of separation
The separation of compounds by capillary electrophoresis is dependent on the differential migration of analytes in an applied electric field. The electrophoretic migration velocity (up) of an analyte toward the electrode of opposite charge is:
where μp is the electrophoretic mobility and E is the electric field strength. The electrophoretic mobility is proportional to the ionic charge of a sample and inversely proportional to any frictional forces present in the buffer. When two species in a sample have different charges or experience different frictional forces, they will separate from one another as they migrate through a buffer solution. The frictional forces experienced by an analyte ion depend on the viscosity (η) of the medium and the size and shape of the ion. Accordingly, the electrophoretic mobility of an analyte at a given pH is given by:
where z is the net charge of the analyte and r is the Stokes radius of the analyte. The Stokes radius is given by:
where kB is the Boltzmann constant, and T is the temperature, D is the diffusion coefficient. These equations indicate that the electrophoretic mobility of the analyte is proportional to the charge of the analyte and inversely proportional to its radius. The electrophoretic mobility can be determined experimentally from the migration time and the field strength:
where L is the distance from the inlet to the detection point, tr is the time required for the analyte to reach the detection point (migration time), V is the applied voltage (field strength), and Lt is the total length of the capillary. Since only charged ions are affected by the electric field, neutral analytes are poorly separated by capillary electrophoresis.
The velocity of migration of an analyte in capillary electrophoresis will also depend upon the rate of electroosmotic flow (EOF) of the buffer solution. In a typical system, the electroosmotic flow is directed toward the negatively charged cathode so that the buffer flows through the capillary from the source vial to the destination vial. Separated by differing electrophoretic mobilities, analytes migrate toward the electrode of opposite charge. As a result, negatively charged analytes are attracted to the positively charged anode, counter to the EOF, while positively charged analytes are attracted to the cathode, in agreement with the EOF as depicted in figure 3.
Figure 3: Diagram of the separation of charged and neutral analytes (A) according to their respective electrophoretic and electroosmotic flow mobilities
The velocity of the electroosmotic flow, uo can be written as:
uo = μoE
where μo is the electroosmotic mobility, which is defined as:
where ζ is the zeta potential of the capillary wall, and ε is the relative permittivity of the buffer solution. Experimentally, the electroosmotic mobility can be determined by measuring the retention time of a neutral analyte. The velocity (u) of an analyte in an electric field can then be defined as:
up + uo = (μp + μo)E
Since the electroosmotic flow of the buffer solution is generally greater than that of the electrophoretic flow of the analytes, all analytes are carried along with the buffer solution toward the cathode. Even small, triply charged anions can be redirected to the cathode by the relatively powerful EOF of the buffer solution. Negatively charged analytes are retained longer in the capilliary due to their conflicting electrophoretic mobilities. The order of migration seen by the detector is shown in figure 3: small multiply charged cations migrate quickly and small multiply charged anions are retained strongly.
Electroosmotic flow is observed when an electric field is applied to a solution in a capillary that has fixed charges on its interior wall. Charge is accumulated on the inner surface of a capillary when a buffer solution is placed inside the capillary. In a fused-silica capillary, silanol (Si-OH) groups attached to the interior wall of the capillary are ionized to negatively charged silanoate (Si-O-) groups at pH values greater than three. The ionization of the capillary wall can be enhanced by first running a basic solution, such as NaOH or KOH through the capillary prior to introducing the buffer solution. Attracted to the negatively charged silanoate groups, the positively charged cations of the buffer solution will form two inner layers of cations (called the diffuse double layer or the electrical double layer) on the capillary wall as shown in figure 4. The first layer is referred to as the fixed layer because it is held tightly to the silanoate groups. The outer layer, called the mobile layer, is farther from the silanoate groups. The mobile cation layer is pulled in the direction of the negatively charged cathode when an electric field is applied. Since these cations are solvated, the bulk buffer solution migrates with the mobile layer, causing the electroosmotic flow of the buffer solution. Other capillaries including Teflon capillaries also exhibit electroosmotic flow. The EOF of these capillaries is probably the result of adsorption of the electrically charged ions of the buffer onto the capillary walls. The rate of EOF is dependent on the field strength and the charge density of the capillary wall. The wall's charge density is proportional to the pH of the buffer solution. The electroosmotic flow will increase with pH until all of the available silanols lining the wall of the capillary are fully ionized.
Figure 4: Depiction of the interior of a fused-silica gel capillary in the presence of a buffer solution.
Efficiency and resolution
The number of theoretical plates, or separation efficiency, in capillary electrophoresis is given by:
where N is the number of theoretical plates, μ is the apparent mobility in the separation medium and Dm is the diffusion coefficient of the analyte. According to this equation, the efficiency of separation is only limited by diffusion and is proportional to the strength of the electric field. The efficiency of capillary electrophoresis separations is typically much higher than the efficiency of other separation techniques like HPLC. Unlike HPLC, in capillary electrophoresis there is no mass transfer between phases.[3] In addition, the flow profile in EOF-driven systems is flat, rather than the rounded laminar flow profile characteristic of the pressure-driven flow in chromatography columns as shown in figure 5. As a result, EOF does not significantly contribute to band broadening as in pressure-driven chromatography. Capillary electrophoresis separations can have several hundred thousand theoretical plates.
The resolution (Rs) of capillary electrophoresis separations can be written as:
According to this equation, maximum resolution is reached when the electrophoretic and electroosmotic mobilities are similar in magnitude and opposite in sign. In addition, it can be seen that high resolution requires lower velocity and, correspondingly, increased analysis time.
Related techniques
As discussed above, separations in a capillary electrophoresis system are typically dependent on the analytes having different electrophoretic mobilities. However, some classes of analyte cannot be separated by this effect because they are neutral (uncharged) or because they may not differ significantly in electrophoretic mobility. However, there are several techniques that can help separate such analytes with a capillary electrophoresis system. Adding a surfactant to the electrolyte can facilitate the separation of neutral compounds by micellar electrokinetic chromatography. Charged polymers such as DNA can be separated by filling the capillary with a gel matrix that retards longer strands more than shorter strands. This is called capillary gel electrophoresis. This is a high-resolution alternative to slab gel electrophoresis. Some capillary electrophoresis systems can also be used for microscale liquid chromatography or capillary electrochromatography. A capillary electrophoresis system can also be used for isotachophoresis and isoelectric focusing.
NOTE: Figures are not shown here