TITRATION CURVE OF AMINO ACIDS
(Determination of pKa and pI values of amino acids)
Objectives:
1) To determine the titration curve for an amino acid and
2) To use this curve to estimate the pKa values (pKa1, pKa2 and pKa3) of the ionizable groups of the amino acid and the amino acid’s pI.
Introduction:
A titration curve of an amino acid is a plot of the pH of a weak acid against the degree of neutralization of the acid by standard (strong) base. Consider the ionization of a weak organic acid such as acetic acid by NaOH.
As more of the strong base (titrant) is added to the aqueous solution, more of the weak acid is converted to its conjugate base. During this process, a buffer system forms and the pH of the system will follow the Henderson-Hasselbalch relationship. The titration curve of the neutralization of acetic acid by NaOH will look like this:
When a weak monoprotic acid is titrated by a base, a buffer system is formed. The pH of this system follows the Henderson-Hasselbalch equation:
This curve empirically defines several characteristics (the precise number of each characteristic depends on the nature of the acid being titrated): 1) the number of ionizing groups, 2) the pKa of the ionizing group(s), 3) the buffer region(s).
Based on the number of plateaus on a titration curve, one can determine the number of dissociable protons in a molecule. The one plateau observed when acetic acid is titrated indicates that it is a monoprotic acid (i.e., has only one dissociable H+). Many organic acids are polyprotic (have > one dissociable H+).
The protein building blocks, amino acids, are polyprotic and have the general structure
The majority of the standard amino acids are diprotic molecules since they have two dissociable protons: one on the alpha amino group and other on the alpha carboxy group. There is no dissociable proton in the R group. This type of amino acid is called a “simple amino acid”. A simple amino acid is electrically neutral under physiological conditions. NOTE: Under this definition it is possible to have a simple amino acid which is triprotic. Which of the 20 common or standard amino acids are simple & triprotic? Ionization of a diprotic amino acid will proceed as follows:
The order of proton dissociation depends on the acidity of the proton: that which is most acidic (lower pKa) will dissociate first. Consequently, the H+ on the α-COOH group (pKa1) will dissociate before that on the α-NH3 group (pKa2). The titration curve for this process looks similar to the following:
This curve reveals, in addition to the same information observed with a monoprotic acid, an additional characteristic of polyprotic acids and that is the pH at which the net charge on the molecule is zero. This pH defines the isoelectric point (pI) of the molecule, a useful constant in characterizing and purifying molecules. Using a titration curve, the pI can be empirically determined as the inflection point between the pKa of the anionic and cationic forms. Mathematically, the pI can be determined by taking the average of the pKa for the anionic and cationic forms. The ionic form of the molecule having a net charge of zero is called the zwitterion.
A few amino acids are classified as triprotic. This is because, in addition to the ionizable protons of the α-COOH and α-NH3 groups, they also have a dissociable proton in their R group. Although triprotic amino acids can exist as zwitterions, under physiological conditions these amino acids will be charged. If the net charge under physiological conditions is negative, the amino acid is classified as an acidic amino acid because the R group has a proton that dissociates at a pH significantly below pH 7. The remaining triprotic amino acids are classified as basic amino acids due to a) their having a net positive charge under physiological conditions and b) an R group dissociable proton with a pKa near or greater than pH 7. Titration curves for triprotic amino acids generate the same information as those for the diprotic amino acids. The pI for a triprotic amino acid can be determined graphically, although this is somewhat more challenging. Graphical determination, as was the case with the diprotic acids, requires one to know the ionic forms of the amino acid and finding the inflection point between the cationic and anionic forms. Mathematically, the pI for an acidic amino acid is the average of pKa1 and pKaR (the pKa of the dissociable proton in the R group); for a basic amino acid, it is the average of pKa2 and pKaR.
Table: 1 Amino Acid Classification Based on Number of Dissociable Protons
1-Letter code |
3-Letter code |
Name |
|
Classification |
A |
Ala |
Alanine |
Alanine |
Simple |
C |
Cys |
Cysteine |
Cysteine |
Simple |
D |
Asp |
Aspartate |
AsparDic acid |
Acidic |
E |
Glu |
Glutamate |
GluEtamic acid |
Acidic |
F |
Phe |
Phenylalanine |
Fenylalanine |
Simple |
G |
Gly |
Glycine |
Glycine |
Simple |
H |
His |
Histidine |
Histidine |
Basic |
I |
Ile |
Isoleucine |
Isoleucine |
Simple |
K |
Lys |
Lysine |
before L |
Basic |
L |
Leu |
Leucine |
Leucine |
Simple |
M |
Met |
Methionine |
Methionine |
Simple |
N |
Asn |
Asparagine |
asparagiNe |
Simple |
P |
Pro |
Proline |
Proline |
Simple |
Q |
Gln |
Glutamine |
Q-tamine |
Simple |
R |
Arg |
Arginine |
aRginine |
Basic |
S |
Ser |
Serine |
Serine |
Simple |
T |
Thr |
Threonine |
Threonine |
Simple |
V |
Val |
Valine |
Valine |
Simple |
W |
Trp |
Tryptophan |
tWo rings |
Simple |
Y |
Tyr |
Tyrosine |
tYrosine |
Simple |
*EG Schulz and RH Schirmer, Principles of Protein Structure (1979), p. 2.
Use of the pH meters.
1. Plug in the meter
2. By GENTLY twisting and pulling remove the cap from the electrode. Be careful not to spill the electrode storage solution.
3. Open the hole at the top of the electrode, there is a plastic door that slides open to expose hole
4. Rinse the electrode with deionized water
5. Standardize the meter (steps 6 – 11)
6. If the display reads a small number 4 and/or 7 press “Set up”
7. When screen reads “clear” press “enter” (this removes old standards)
8. Place electrode in pH 4.0 buffer (pink)
9. Press “Standardize”
You should see numbers 2, 4, 7, 10, 12 and an icon of an electrode blinking
When meter is standardized an upper case S will appear in a box on the display, followed by (pH 100) also a small number 4 should appear and stay.
Rinse electrode again in deionized water
10. Place electrode in buffer pH 7.0
11. Repeat step 9, once again when the meter is standardized an upper case S will appear in a box on the display. Now it will be followed by a number from 90 to 105 and the number 4 and 7 should appear and remain on the display. (you are now ready to measure pH)
12. Immerse the electrode in the solution, when the upper case S appears the reading is steady and record this pH
Procedures:
A) Determine the titration curve for an amino acid
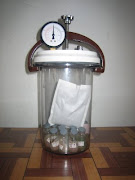
1. Using a 25-mL graduated cylinder or serological pipet, transfer 25 mL of a 0.2 M amino acid solution to a 150 - 250 mL beaker. Set up the apparatus as shown below:
2. Titrate the amino acid with 1.0 M HCl (titrant)
a. Determine the pH of the amino acid solution before the addition of titrant.
b. Initially add approximately 0.5 mL of the titrant to the amino acid at a time. Record the data IN YOUR NOTEBOOK as indicated below.
mL 1.0 M HCl pH
0.0
0.5
1.0
etc.
Note: In the beginning, the pH will change very dramatically with each addition of titrant. As you get closer to the pKa of the ionizable group, the pH will change much more slowly. When this phenomenon occurs, add 1 mL of titrant at a time.
c. After the addition of each volume of HCl, stir the solution briefly.
d. Turn the stirrer off and measure the pH using the pH meter.
e. Continue with the titration until the pH ~1.5.
3. Repeat steps 1 and 2 above, this time using 1.0 N NaOH as the titrant for a fresh 25-mL sample of the same amino acid. Record the data IN YOUR NOTEBOOK until you get to pH ~13.
mL 1.0 M NaOH pH
0.0
0.5
1.0
etc.
B) Estimate the amino acid's pKa values of the ionizable groups and its pI.
4. Using Microsoft Excel (or some similar program), construct your titration curve plotting pH versus mL of acid and base added to the amino acid solution as indicated below.
5. On your curve, designate the buffer region(s), pKa(s), and the amino acid’s pI.
6. From your graph, estimate the pKa values of the ionizing groups and the pI of the amino acid. Compare your experimental values with those found in the literature. You can, for example, use either the Handbook of Biochemistry or your textbook. Cite some reasons why your values might differ from those found in the literature.
In your report, you must categorize your amino acid as diprotic or triprotic. Based on the pKa values in the lecture Textbook state which amino acids are possibilities.
Record data in your notebook:
 Titration Curve of an Amino Acid STUDY GUIDE
1. Draw the titration curve of an amino acid having only two ionizable groups (e.g., glycine). Indicate on the curve the pKa values of the α-COOH (pKa1) and α-NH3 (pKa2) groups, and the pI of the amino acid.
2. The prevailing structure of the molecules in the 0.2 M amino acid solution used in today’s experiment before titrating with 1 M HCl or 1 M NaOH is
What is the structure produced after the amino acid is titrated with 1 M HCl? With 1 M NaOH?
3. Why must the magnetic stirrer be stopped each time before reading the pH?
4. Consider the following amino acid for questions 4a – 4d.
a. Is this a diprotic or triprotic amino acid?
b. Draw the titration curve if this molecule were titrated with 1M NaOH.
c. Where would the pKa values appear on this curve?
d. What group is ionizing at each pKa?
5. Consider the amino acid D having pKa’s of 1.99 (pKa1), 3.90 (pKaR), and 9.90 (pKa2). What is its pI?
6. At what pH are the anion and zwitterion species of equal concentration for an amino acid having no ionizable group in the side chain?
7. Why is the amino acid Y, which has three ionizable groups 2.20 (pKa1), 9.21 (pKa2), and 10.5 (pKaR), considered a simple amino acid?
8. At what pH will the amino acid containing a negative group in the side chain not migrate in an electric field?
9. Consider the amino acid H (pKaR = 6.00) for a – c below.
a. What is its predominant ionic form at pH 7.40?
b. Draw the structure of the conjugate base/weak acid pair that exists in solution at pH 7.00.
c. What is the ratio of conjugate base to weak acid in an H buffer if the pH drops to one unit below pKaR?
10. If one is given an amino acid such as lysine to titrate and construct a titration curve, one might observe two, not three, buffer regions. Why?
11. The initial pH of a 0.2M arginine solution is 14.
a. What is the predominant structure of arginine in solution at this pH?
b. Draw the titration curve that would result if this solution were titrated with 1M HCl to pH 7.
Table 2: pKa and pI values of Standard amino acids
S. no. |
Amino Acid |
a-carboxylic acid |
a-amino |
Side chain |
1. |
Alanine |
2.35 |
9.87 |
|
2. |
Arginine |
2.01 |
9.04 |
12.48 |
3. |
Asparagine |
2.02 |
8.80 |
|
4. |
Aspartic Acid |
2.10 |
9.82 |
3.86 |
5. |
Cysteine |
2.05 |
10.25 |
8.00 |
6. |
Glutamic Acid |
2.10 |
9.47 |
4.07 |
7. |
Glutamine |
2.17 |
9.13 |
|
8. |
Glycine |
2.35 |
9.78 |
|
9. |
Histidine |
1.77 |
9.18 |
6.10 |
10. |
Isoleucine |
2.32 |
9.76 |
|
11. |
Leucine |
2.33 |
9.74 |
|
12. |
Lysine |
2.18 |
8.95 |
10.53 |
13. |
Methionine |
2.28 |
9.21 |
|
14. |
Phenylalanine |
2.58 |
9.24 |
|
15. |
Proline |
2.00 |
10.60 |
|
16. |
Serine |
2.21 |
9.15 |
|
17. |
Threonine |
2.09 |
9.10 |
|
18. |
Tryptophan |
2.38 |
9.39 |
|
19. |
Tyrosine |
2.20 |
9.11 |
10.07 |
20. |
Valine |
2.29 |
9.72 |
|
|