Spectroscopy was originally the study of
the interaction between radiation and matter as a function of wavelength
(λ).
Spectrometry is the spectroscopic
technique used to assess the concentration or amount of a given species. In
those cases, the instrument that performs such measurements is a spectrometer
or spectrograph.
Spectroscopy/spectrometry
is often used in physical and analytical chemistry for the identification of
substances through the spectrum emitted from or absorbed by them.
Spectroscopy/spectrometry
is also heavily used in astronomy and remote
sensing. Most large telescopes have spectrometers, which are used either to
measure the chemical composition and physical properties of astronomical
objects or to measure their velocities from the Doppler
shift of their spectral lines.
Practical Significance: - Monochromatic wave
X-rays Medicinal Procedures
UV-rays Sun burns, Spectrophotometry
Visible Spectrophotometry,
Colorimetry
Radio/Radar Communication
UV/Visible Spectrophotometry and Colorimetry
·
Absorption spectrophotometry in the ultraviolet
and visible region is considered to be one of the oldest physical methods used
for quantitative analysis and structural elucidation.
Absorption spectroscopy
•
Light is only absorbed if its energy (i.e. frequency)
corresponds to the energy difference between two quantum levels in the sample
•
Described by the Bohr frequency condition:
Δ E = E1− E2 = h g
where;
h = Planck’s constant = 6.63×10⁻³⁴
J·s
g = frequency of light (in Hz)
Wavelength:
λ = g / c (c: speed of light)
Wave number: n = 1 / λ
Absorption of radiation
·
Light that is incident on a color sample is
partially absorbed by it.
·
i.e.: at a certain wavelength there is less
intensity coming out on the other side.
·
There is no breakdown in the law of conservation
of energy, however. The result of the absorption may appear as:
·
Heat producing a temperature rise in the
sample,
·
Luminescence in which a photon of the
same or lower energy is emitted,
·
Chemical processes that incorporate
energy into altered bonding structures.
·
The main types of instruments in use for
measuring the emission or absorption of radiant energy are: a) photometer. b) Spectrophotometer. c)
Colorimeter
Principle:
·
The study of interaction of light with a matter.
·
Widely used in the investigation of components
of the matter (including living matter) to measure their concentration.
·
Let us consider a light beam passing through a
sample of thickness d with absorbing species of concentration c.
·
The energy carried by the beam light per unit
area per unit time, is called the intensity I and has initial value
equal to I0.
·
The beam passes through the sample and emerges
on the right with decreased, as the result of absorption, intensity It.
·
The “amount” of absorption depends on the sample
thickness d (the path length), the sample concentration c and on
the wavelength λ the light passing
through the sample.

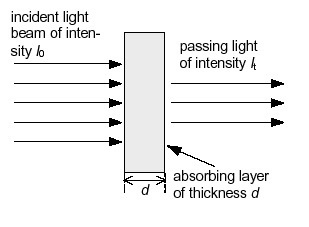
Figure 1: Intensity of
light passing through sample of thickness d is decreased due to
adsorption
Lambert’s law
“When a beam of light is allowed to pass through a
transparent medium, the rate of decrease of intensity with the thickness of
medium is directly proportional to the intensity of light”
It
= I0 e-e c d
Where e
stands for absorption coefficient
%T = Io / It *100
%T = Io / It *100
· The ratio of the intensity of transmitted light (passing through a substance) It to the intensity of the incident light Io is called the transmittance T or, when multiplied by 100%, percentage transmittance:
·
The term absorbance, A, by
definition, is the negative logarithm with base 10 of the transmittance T,
that is:
A = - log10
(T)
Beer’s law
The intensity of a beam of monochromatic light decreases
exponentially with the increase in concentration of the absorbing substance
arithmetically.
·
The absorbance is proportional to the
concentration, c, of the absorbing species and to the length of the
path, d, of electromagnetic radiation through the sample containing the
absorbing species:
A = e c d
Where the symbol ε stands for the absorptivity
(the former name was the extinction coefficient).
·
The absorptivity ε
depends on the wavelength, λ of light and plays
the role of proportionality coefficient.
·
For a given path length and given wavelength the
absorbance, A, is directly proportional to the concentration of a
solution and is a suitable measure of the light absorption phenomenon.
·
If we plot the absorbance A versus
concentration c, we obtain a straight line passing through origin (0, 0)

Combining the above two statement gives the Lambert-beer
law ad states that the rate of decrease
of intensity of light depends on the concentration and thickness of the medium
and can be express by the equation:
A = e c d
Where A = absorbance
ε = molar absorptivity (L mol-1 cm-1)
d = path length of the sample (cm)
c = concentration of the sample in solution (mol L-1)
Absorbance is directly proportional to the other parameters,
as long as the law is obeyed. After certain limitation the law is not obeyed
and the straight line deviates from the normal in extreme cases of the
concentration of samples and is called deviation of the law.
·
It explains why, for measurements made with
samples of the same thickness d, the transmittance T of a sample
decreases exponentially with increasing concentration c of the absorbing
substance. (Fig. 4b).
Limitations of the
Beer-Lambert law
The linearity of the Beer-Lambert law is limited by chemical
and instrumental factors. Causes of nonlinearity include:
- deviations
in absorptivity coefficients at high concentrations (>0.01M) due to
electrostatic interactions between molecules in close proximity
- scattering
of light due to particulates in the sample
- fluorescence
or phosphorescence of the sample
- changes in
refractive index at high analyte concentration
- shifts in
chemical equilibrium as a function of concentration
- non-monochromatic
radiation, deviations can be minimized by using a relatively flat part of
the absorption spectrum such as the maximum of an absorption band
- stray
light
Concept of λmax
·
For a given substance at a specified wavelength λ,
the absorptivity ελ is a
constant characteristic of the absorbing sample and is independent of both the
concentration c of the solution and the thickness d of the
absorbing layer.
·
Absorptivity and, the absorption itself depends
strongly on the wavelength for nearly all compounds,
·
So, we must specify the wavelength at which the
measurement of the absorbance versus concentration is made.
·
The way in which absorbance depends on
wavelength, A= f(c) , defines the spectrum of the substance being
studied (Fig. 5).

·
During spectrophotometric measurements the
highest accuracy is achieved when these measurements are made at the wavelength
at which the absorbance A takes the highest value.
Question:
Why do we prefer to express the Beer-Lambert law using absorbance as a measure
of the absorption rather than %T ?
Equation A = e c d
% T = e -e c d
Now, suppose we have a solution of copper
sulphate (which appears blue because it has an absorption maximum at 600 nm).
We look at the way in which the intensity of the light (radiant power) changes
as it passes through the solution in a 1 cm cuvette. We will look at the
reduction every 0.2 cm as shown in the diagram below.
The Law says that the fraction of the light
absorbed by each layer of solution is the same.
For our illustration, we will suppose that this
fraction is 0.5 for each 0.2 cm "layer" and calculate the following
data:
Path length / cm
|
0
|
0.2
|
0.4
|
0.6
|
0.8
|
1.0
|
%T
|
100
|
50
|
25
|
12.5
|
6.25
|
3.125
|
Absorbance
|
0
|
0.3
|
0.6
|
0.9
|
1.2
|
1.5
|
The linear relationship between concentration and
absorbance is both simple and straightforward, which is why we prefer to
express the Beer-Lambert law using absorbance as a measure of the absorption
rather than %T.
Note: that the Law is not obeyed at high concentrations. This deviation from the Law is not dealt with here.
Question:
What is the significance of the molar absorbtivity, e ?
To begin we will rearrange the equation A =
ε c d
e = A / d c
In words, this relationship can be stated as
"e is a measure of the
amount of light absorbed per unit concentration".
Molar absorptivity is a constant for a particular
substance, so if the concentration of the solution is halved so is the
absorbance, which is exactly what you would expect.
Let us take a compound with a very high value of
molar absorptivity, say 100,000 L mol-1 cm-1, which is in
a solution in a 1 cm pathlength cuvette and gives an absorbance of 1.
e
= 1 / 1 ´ c Therefore, c
= 1 / 100,000 = 1 ´ 10-5
mol L-1
Now let us take a compound with a very low value
of e, say 20 L mol-1 cm-1
which is in solution in a 1 cm pathlength cuvette and gives an absorbance
of 1.
e = 1
/ 1 ´ c
Therefore, c = 1 / 20 = 0.05 mol L-1
The answer is now obvious - a compound with a
high molar absorptivity is very effective at absorbing light (of the
appropriate wavelength), and hence low concentrations of a compound with a high
molar absorptivity can be easily detected.
Spectrophotometry:
Instrumentation

Instrumentation

All photometers, colorimeters and
spectrophotometers have the following basic components:
a) Source: continuous source of radiant
energy covering the region of spectrum in which the instrument is designed to
work.
i.
Visible spectrum (320-700nm)- Tungsten lamp
ii.
UV-range (220-300 nm)- H2/2H2
lamp (Deuterium lamp)
·
Heating the tungsten lamp at 1725 °C- 1%
of radiation is in between UV-visible range.
·
Heating the tungsten lamp at 2700 °C-
15% of radiation is in between UV-visible range.
·
Should be heated in control environment.
b) Filter or monochromator: allow the
light of the required wavelength to pass through but absorbs the light of other
wavelength.
i.
Colorimetry-filters
1.
Transmit some λ absorbing
other
2.
band width-30-250nm
3.
colored glasses/dyes sandwitched in glasses
4.
selection based on absorption and transmission spectra
5.
complementary color (N.B. color-when λ discrimination)

Figure: Complementary hue cycle
Table: Complementary hue (filter selection) for various solutions.
Color of Visible
Light
Color Wavelength,
nm Filter
color
Voilet 400-435 Yellow-Green
Blue 435-480 Yellow
Green-Blue 480-490 Orange
Blue-Green 490-500 Red
Yellow-Green 560-580 Voilet
Yellow 580-595 Blue
Orange 595-610 Blue-green
Red 610-750 Green-blue
(NOTE: blue absorbing
solution appears yellow or green absorbing solution appears purple)
c) Sample cells:
·
A container for the sample.
·
Cuvettes- transparent for λ, reproducible path length
·
Should transmit the maximum wavelength
·
Should be economic
·
Different cuvette for different transmission
capacity
a.
Glass cuvettes- λ=400-2500nm
b.
Quartz λ=200nm
c.
Silica λ<180 nm="" o:p="">
d.
Pyrex λ=300-2500nm
e.
d) Detector: for measuring the radiant
energy transmitted through the sample.
a.
Broad λ,
sensitive, rapid responding, amplifiable signal
b.
Two types =
1.
Heat detector- IR, heat detection
2.
Photodetector-
a.
photon amplification
b.
radiant energy to electrical
c.
three different types of photodetector:
i.
photovoltaic cell
ii.
phototubes
iii.
photo amplifiers
I. Photovoltaic cell:
There are different designs of
photovoltaic cells. It operates without the use of a battery. A typical
photovoltaic cell consists of a metal base plate (irons or aluminium) acts as
one electrode. On the surface of the base plate, semiconductor thin metal layer
of selenium is coated. Further it is covered by a thin layer of silver or gold
on the outer most surface. It acts as a second collector electrode. When incident
radiation strikes at surface it generates electrons in Se-Ag interface. Then
the electrons are collected by silver and created electric voltage. It is limited
to visible region (450-650 nm) and sensitive to the whole visible range.
However output depends upon the wavelength of the incident light. Current can’t
be amplified readily in this design and so there are fatigue effects after long
time operation.

Figure:
Photovoltaic cells
II. Phototubes:
It is also known as photo-emissive
cells. It consists of an evacuated glass bulb, inside which a light sensitive
cathode in form of a half cylinder of metal is fitted. The cathode is coated
with light sensitive layer, cesium, potassium oxide or silver oxide. A metal
ring is inserted near the center acts as an anode for capturing of electrons. The
incident beam when falls on cathode it emits photoelectrons which are attracted
by an anode. The electrons return via the external circuit which is amplified
to read out readily. It measures the amount of the light striking the
photo-sensitive surface and expressing it in absorbance or transmittance or
concentration forms. For the wavelength of 350-450 nm the cathode should be
coated with sodium.

Figure: Phototubes
III. Photo amplifiers:
It is one of the highly sensitive
devices used today. It consists of an
electrode covered with a photoemissive material. A large number of plates known
as dynodes are used. A dynode is cover with a material which emits several
electrons. Once electrons are ejected from the cathode and accelerated to the
sensitive surface of the dynode, secondary electrons are emitted in greater
amount than the striking the plate by 4 x to 5 x factor Each dynode is
maintained at 75-100 V more positive than the preceding dynode. Over all
amplification by about 10 dynodes will be 106. So it can be used to
measure the intensities about 200 x weaker than those by conventional methods.
It also prevents from stray light.

Figure: Photo
amplifier
How to
use?
·
Warm up an instrument for 10-30 minutes
·
Set a suitable wavelength and switch on
respective lamp
·
Use of optically matched cuvettes
·
Blank- all expect the sample under test
·
Zeroing- with blank
·
Absorbance start from dilute sample
§
Use of standard calibration curve
§
Interpolation is critical-Job’s Phenomenon
·
Accuracy of instrument may not be uniform for
all λ or T-range
§
20-80 % transmission (sd=±2)
·
Error at low or high absorbance values so best
to try middle of T-range
·
Select complementary hue.
Applications:-
— Qualitative
Analysis:
— To
identify compound in pure / biological mixture
— To
confirm the presence of particular compound in the mixture
— Quantitative
Analysis
— For
the estimation of any organic and inorganic compounds such as
— Chromophores
= absorbs specific wavelength of light
— Protein
= 280 nm
— Nucleic
acids = 260 nm
— Amino
acids estimation by Ninhydrin = 570 nm
— Bradford
for protein estimation = 595 nm
— Total
carbohydrate estimation
— Binding
Spectra
— Can
be used in the study of enzyme kinetics e.g. ALT and AST profile
— To
know whether the reaction is complete or not
— Estimation
of reactants and products
— Structural
studies
— SS
DNA, DS DNA, RNA
— Binding
to DNA by ethidium bromide
— Addition
of functional group shift the wavelength maxima